Image analysis has been used with medical imagery for decades and countless algorithms have been developed to increase quality of care and decrease prices. Unfortunately, there are still analysis challenges that require automation, quality improvements, and the ability to adapt for new instrument modalities. That’s where we come in.
Fibrosis Quantification
In the following example we discuss automating detection and classification of various objects in whole slide fluorescent microscopy of liver in order to reliably quantify the amount of fibrosis present in the tissue. ViQi can efficiently process very large multi-channel images making it a perfect fit for this modality.
Liver Fibrosis and Steatosis are detectable and quantifiable by fiber activity (visible in green) as well as by the fat vacuoles (visible as small dark vacuoles in the red channel). We will look at both of these processes in order to improve overall quantification.

Fiber Classification
Fiber detection has been previously developed and validated and it would be ideal to build upon it. Fibers located in different regions affect disease progression differently so the activity should be characterized per type. Because of this, we want to augment an existing fiber segmentation algorithm to further classify detected fibers into 3 distinct types.

We started by annotating 5 whole slide images with 3 semantic types of interest, producing about 500 samples in 30 minutes, visible here in distinct colors.

Then, we have used the annotated dataset to train a deep learning model. Since there are so few training samples (500 for 3 classes) the system augmented their number by 10 times by rotating, scaling and otherwise perturbing the samples giving a bit more data for the deep network to chew on.
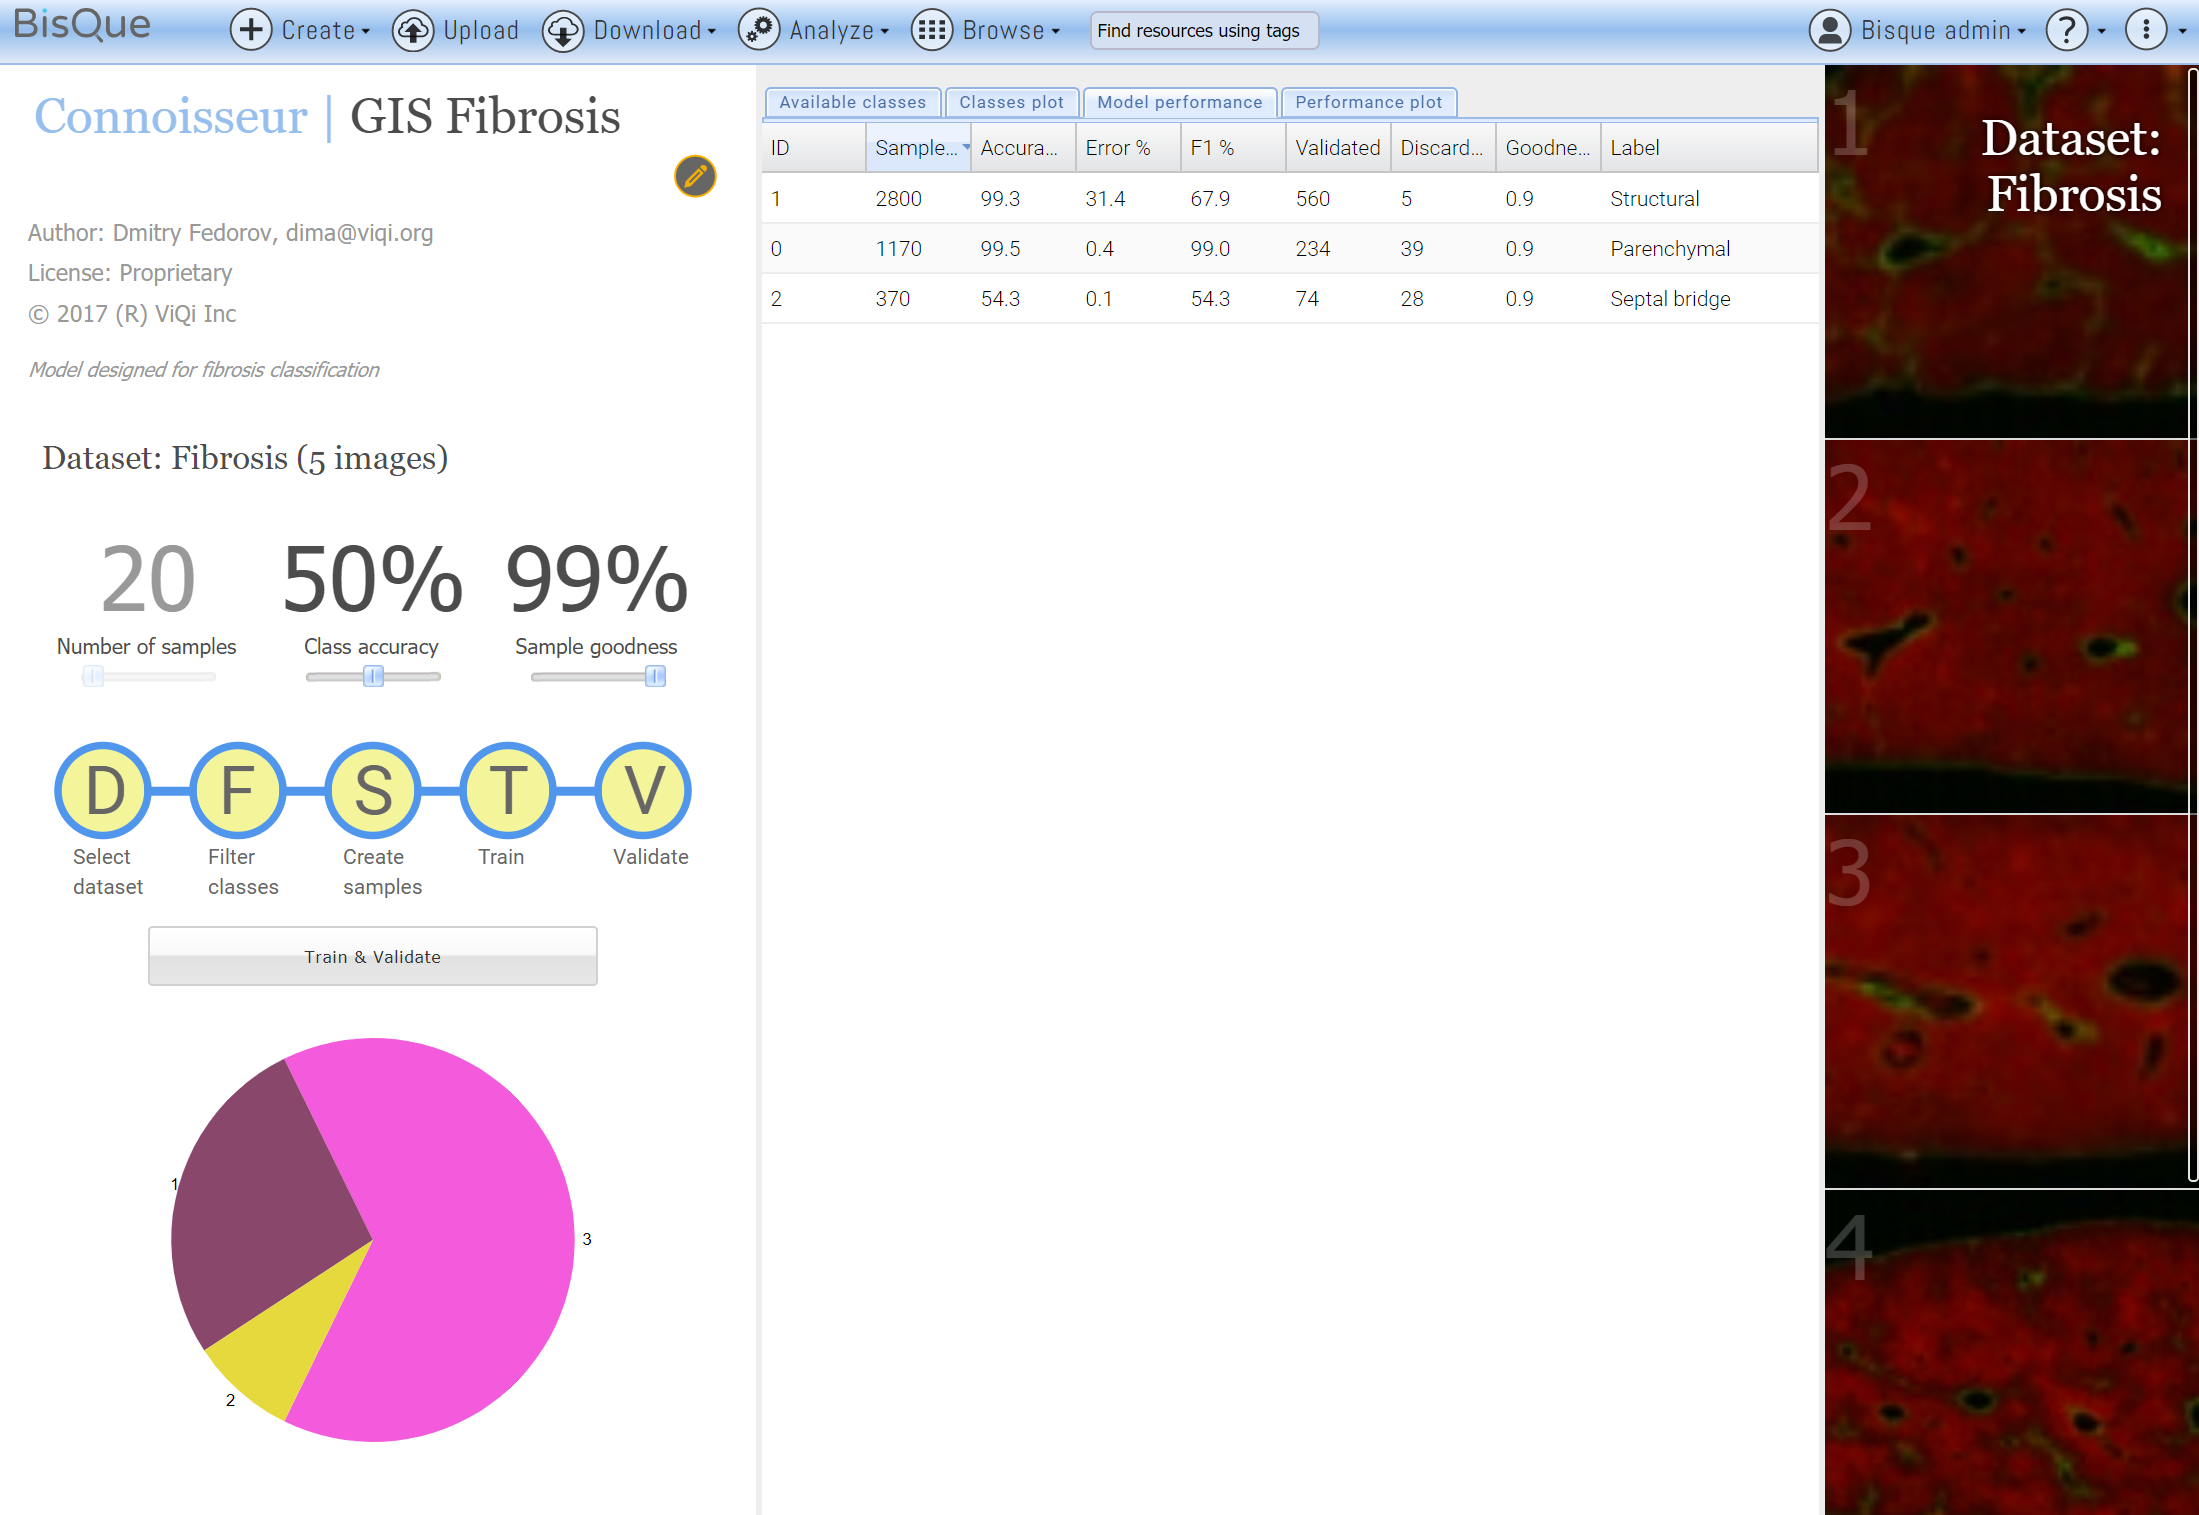
This quick training session produced decent results, giving 99% accuracy for Structural and Parenchymal types and 54% for the septal bridges. A quick check of the model partitioning the image into small polygonal regions is encouraging.

This performance is a great start since we have many samples to work with from the previously developed segmentation. The Connoisseur RESTful API is then used to classify only the segmented pixels producing the following semantic segmentation.

Fat Vacuole Detection
The next step is in improving Steatosis quantification by detecting Fat Vacuoles, visible here as small dark circles. Previously developed morphometric algorithm is performing really well but makes small mistakes in the blood vessel regions and could be improved.

We start by creating 300 point annotations of two classes indicating proper fat vacuoles and spurious regions of leakage.

Model trained on this dataset demonstrates good results at separating fat vacuoles from blood vessels.

Finally we can combine the previously developed fat vacuole detection algorithm with an additional safeguard step to reject/accept detected fat vacuoles using Connoisseur RESTful API. Here rejected fat vacuoles are visible in red.

Conclusion
The ViQi's Connoisseur system makes it quick and easy to experiment and augment standard image processing algorithms with deep learning classifiers. A real-life solution will of course require a lot more training data and many more annotations and ViQi can help process all that data quickly by seamlessly scaling-up analysis nodes when a large processing is requested. ViQi's in-house image analysis expertise is here to help achieve quality results required for your solution, contact us today to get a demo.
Learn more about ViQi Connoisseur for your machine learning needs.